Contribute news or contact us by sending an email to: RCTonline@gmail.com
Bear Lake Watch-John Holman
As in January, the Upper Bear Basin got a boost in snow water equivalent in February....about 5.3" of SWE which is about 147% of the 1990-2020 median SWE for the month. Things have continued to improve the first few days in March having already received 1.3" SWE; we average 2.8" for the month of March....so almost half way there in the first 7 days. Indeed most if not all the basins in the Great Basin area are at 100% or greater of average SWE. |
The graph on the left is the SWE for Upper Bear Basin on February 29, 2024. as well as the projections for SWE done by NRCS colleagues (thank you). The 50:50 projection, which is a bit hard to see, would run through the median peak SWE which is shown by the X. |
The graph on the left below shows the marina water level from 2010 to current (blue line) with the median water level in yellow/gold. The graph on the right shows the current year and median marina water level from April 2023 to March 2024..
As shown on the graph on the left below, the water level of the Lake has been above the median level only 6 out of 14 years, but this year is poised to be the 7th year above median...and we haven't even had the runoff yet. Current water level is 5917.72 feet, which is 71% full. Inflow is around 270 cfs. |
|
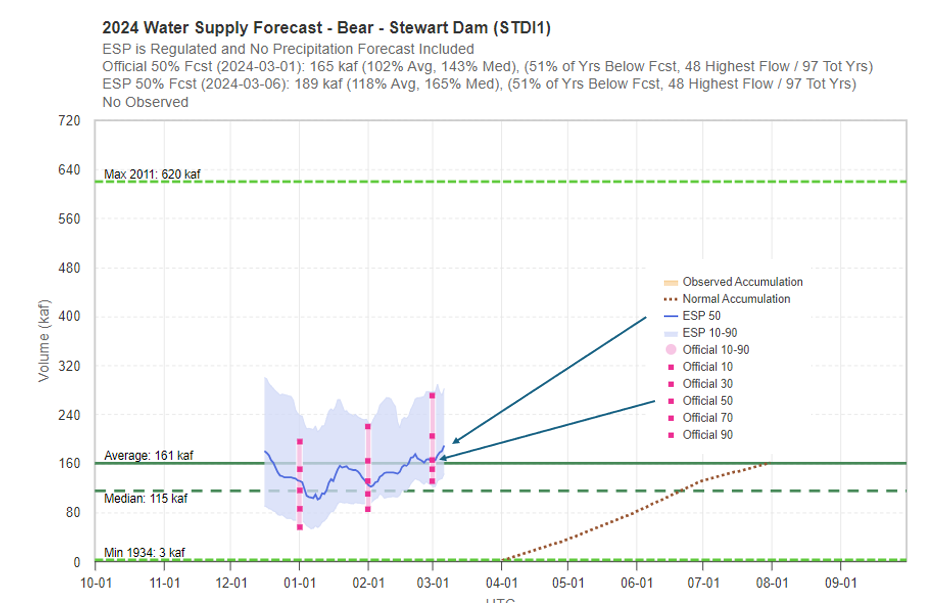
The Colorado Basin River Forecast Center (CBRFC) has also issued its new Water Supply Forecast for the Bear River Basin for March 1st. The graph shown here is the April to July streamflow forecast for Bear River total water flow at Stewart Dam, just above where the water is diverted into Bear Lake. The middle red dot above March 1st date shows the 50:50 forecast is for 165 thousand acre feet of water. And reflecting the precipitation in this past 7 days, the current projection is for 189 thousand acre feet. |
|
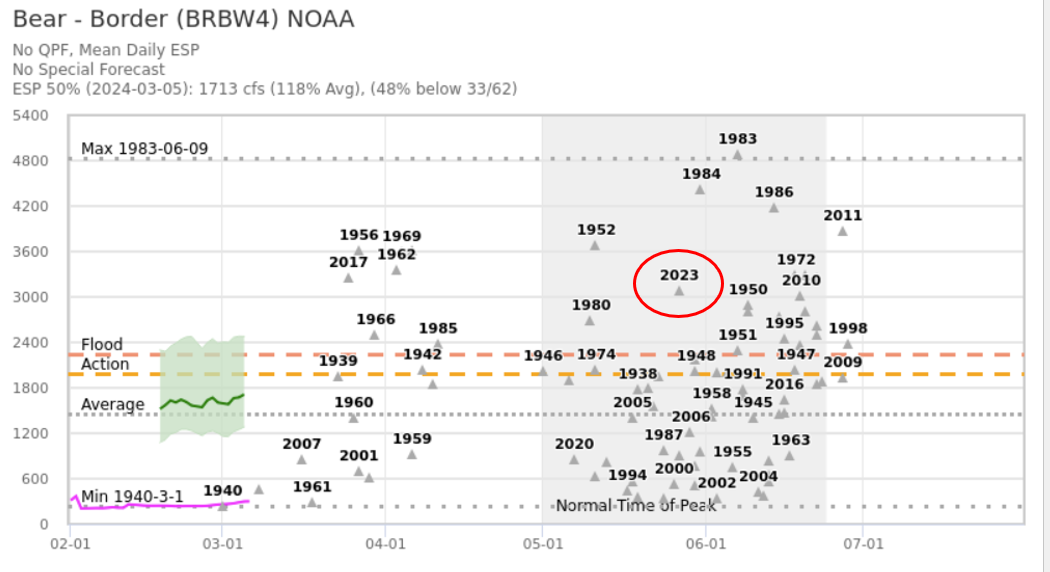
| I thought this graph was interesting. It shows a similar streamflow forecast as above except at the ID-UT border, just upriver from Stewart Dam.
The peak water flow for various years is shown, with the average, Action Stage and Flood Stage values. The projection to date is there is a 10-25% chance of exceeding the Flood Stage. WY2023 is circled. |
|
|
Finally, the National Weather Service forecast for March is about average temperatures and likely above average precipitation. The soil moisture is above average as well so we are set up for a good runoff
As always I want to thank all the people at CRBFC, USGS, NOAA, NRCS, RMP that provide the data and advice for the Splashback.
March Editor: John Holman |
|
BEAR LAKE LEVEL March 7, 2024 5917.72 feet* Water Temperature 36.0o F |
|


No comments:
Post a Comment